In-Class Assignment 15#
In-Class Only, Not Submitted for Credit
Gravity Darkening in Low Mass Stars#
Gravity darkening, also referred to as gravity brightening, is an astronomical phenomenon where the poles of a star are brighter than the equator, due to rapid rotation and oblate shape. When a star is oblate, it has a larger radius at its equator than it does at its poles.
As a result, the poles have a higher surface gravity, and thus higher temperature and pressure is needed to maintain hydrostatic equilibrium. Thus, the poles are “gravity brightened”, and the equator “gravity darkened”. - Wikipedia.
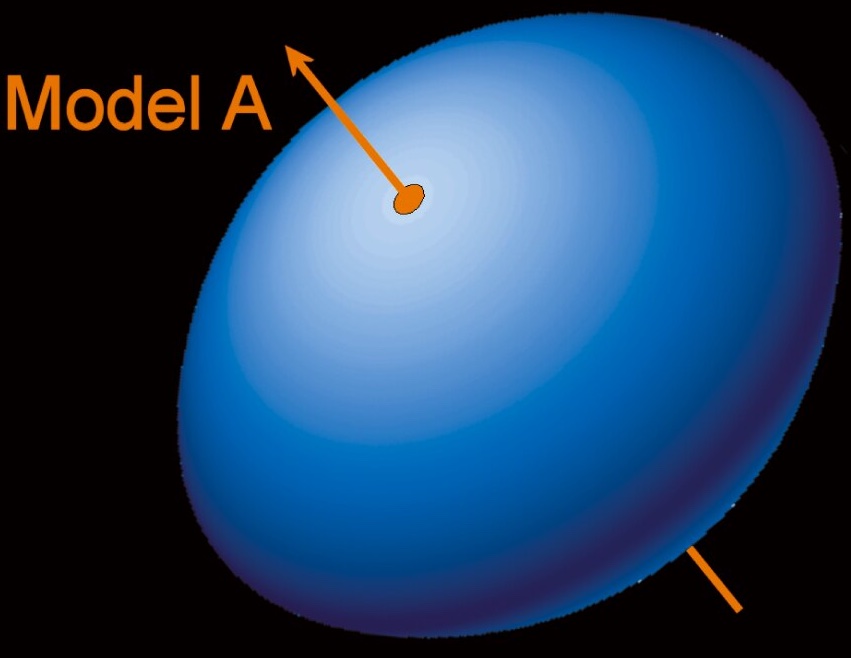
Credit: ESO. Achernar has an unusually rapid rotational velocity, causing it to become oblate in shape.
Learning Objectives#
explore the impact of gravity darkening on HR diagrams
where does ES operate in rotating stars?
determine the impact of rotation on the surface carbon abundance
Download the following model files locally.
3 \(M_{\odot}\) Model with \((\Omega/\Omega_{\rm{crit}})_{i}=0.9\): 3m_high_rot_history.data;
3 \(M_{\odot}\) Model with \((\Omega/\Omega_{\rm{crit}})_{i}=0.9\): 3m_high_rot_profile.data;
3 \(M_{\odot}\) Model with \((\Omega/\Omega_{\rm{crit}})_{i}=0.0\): 3m_non_rot_history.data;
a. - How does Gravity Darkening Affect HR Evolution?#
Using the history data for the rotating and non-rotating models,
plot an HR diagram for non-rotating model (our usual history columns) and the rotating model for the (polar, equatorial, and intrinsic - our total usual values).
State how gravity darking moves the model on the HR, i.e. - hotter/cooler, redder/bluer compared to a non-rotating model.
## a results here
b. - Eddington-Sweet Circulation in Low Mass Rotating Stars#
Using the profile data,
plot the diffusion coefficient profiles for convection (
log_D_conv), overshoot (log_D_ovr), ES (am_log_D_ES) circulation.
Where does the ES circulation operate if anywhere? What can you say about the rotation in these regions?
## b results here
c. - Impact of Rotation in Surface Carbon Abundance#
Using the non-rotating and rotating history data,
plot to the log of the initial versus final surface c12 for both models.
For this mass, does rotationally-induced mixing suggest an increase or decrease to the surface value? Compare with Figure 5 of Heger et al 2000.
## c results here