Star Formation#
Additional Recommended Resource: Theory of Star Formation and Chapter 9 of Notes by Onno Pols.
Wednesday, Apr. 2, 2025
astrophysics of stars and planets - spring 2025 - university of arizona, steward observatory
Today’s Agenda#
Announcements - Homework 4, due April 9 (2m)
Reading Overview/Key Points (10m)
ICA 20 - Kepler Solar-like Oscillator (25m)
Debrief + Share Results (10m)
Star formation and pre-main sequence evolution#
Some general caveats: Star-formation is not very well understood compared to stellar evolution. Key uncertainties still lie in the resulting:
star formation efficiency: the fraction of gas of the interstellar cloud that is turned into stars,
and the
initial mass function: the spectrum and relative probability of stellar masses that are formed.
Whenever possible, we use observational efforts to constrain this and many other uncertainties in star formation.
Observations demonstrate that stars are formed out of molecular clouds, typcially
giant molecular clouds: - masses \(\mathcal{O}(\sim10^{5}M_{\odot})\) - about 10 parsecs in size - 10 - 100 K - densitities of \(\sim\) 10-300 molecules \(cm^{-3}\). - few percent of dust, causing them to be very opaque to visible - roughly in HSE with surrounding ISM
We can describe approximately six stages of Star Formation:
Interstellar cloud collapse#
Star formation stars with a perturbation: a nearby shock or collision moving the cloud out of HSe and inducing collapse under its own gravity.
We can define a critical mass known as the Jeans mass.
The Jeans mass concerns the mass involved in such a perturbation. Should the mass involved be less than the Jean’s mass then the cloud can maintain pressure equilibrium. If not, the filiments will undergo free-fall collapse described by the dynamical timescale, \(\tau_{\rm{dyn}} \sim \rho^{-1/2}\). However, since the densities are so low, this timescale on the order of millions of years.
Definition 126
here, \(n\), is the molecular density by number. The early stages of collapse are isothermal.
Cloud fragmentation#
As the density of the collapsing material increases, the Jeans mass decreases.
Due to the local violation, the cloud begins to fragment into small pieces, which individually continue to collapse until mass of smallest fragments is less than about \(0.1M_{\odot}\).
Formation of a protostellar core#
Looking now to only the collapsing cloud fragment, as the density continues to increase, the gas becomes opaque to infrared photons.
The result is that the radiation is trapped in the causing heating and increase in gas pressure that slows dynamical collapse and the and the fragment comes into HSE.
The fragment continues in HSE and quasi-static contraction.
A protostar is born!
Accretion#
The next phase is dominated by accretion as gas continues to fall onto the protostar. Due to conservation of angular momentum, the accretion leads to the formation of an accretion disk.
Accretion disks are commonplace in the star-formation process and observed around most younf stars, primarily in inrared and submillimeter wavelengths.
The luminosity of this object during this phase is powered by the accretion:
during which the core continues to heat up adiabitcally (\(\tau_{\rm{acc}} \ll \tau_{\rm{KH}}\)).
Examples of protostar accretion disks with JWST:
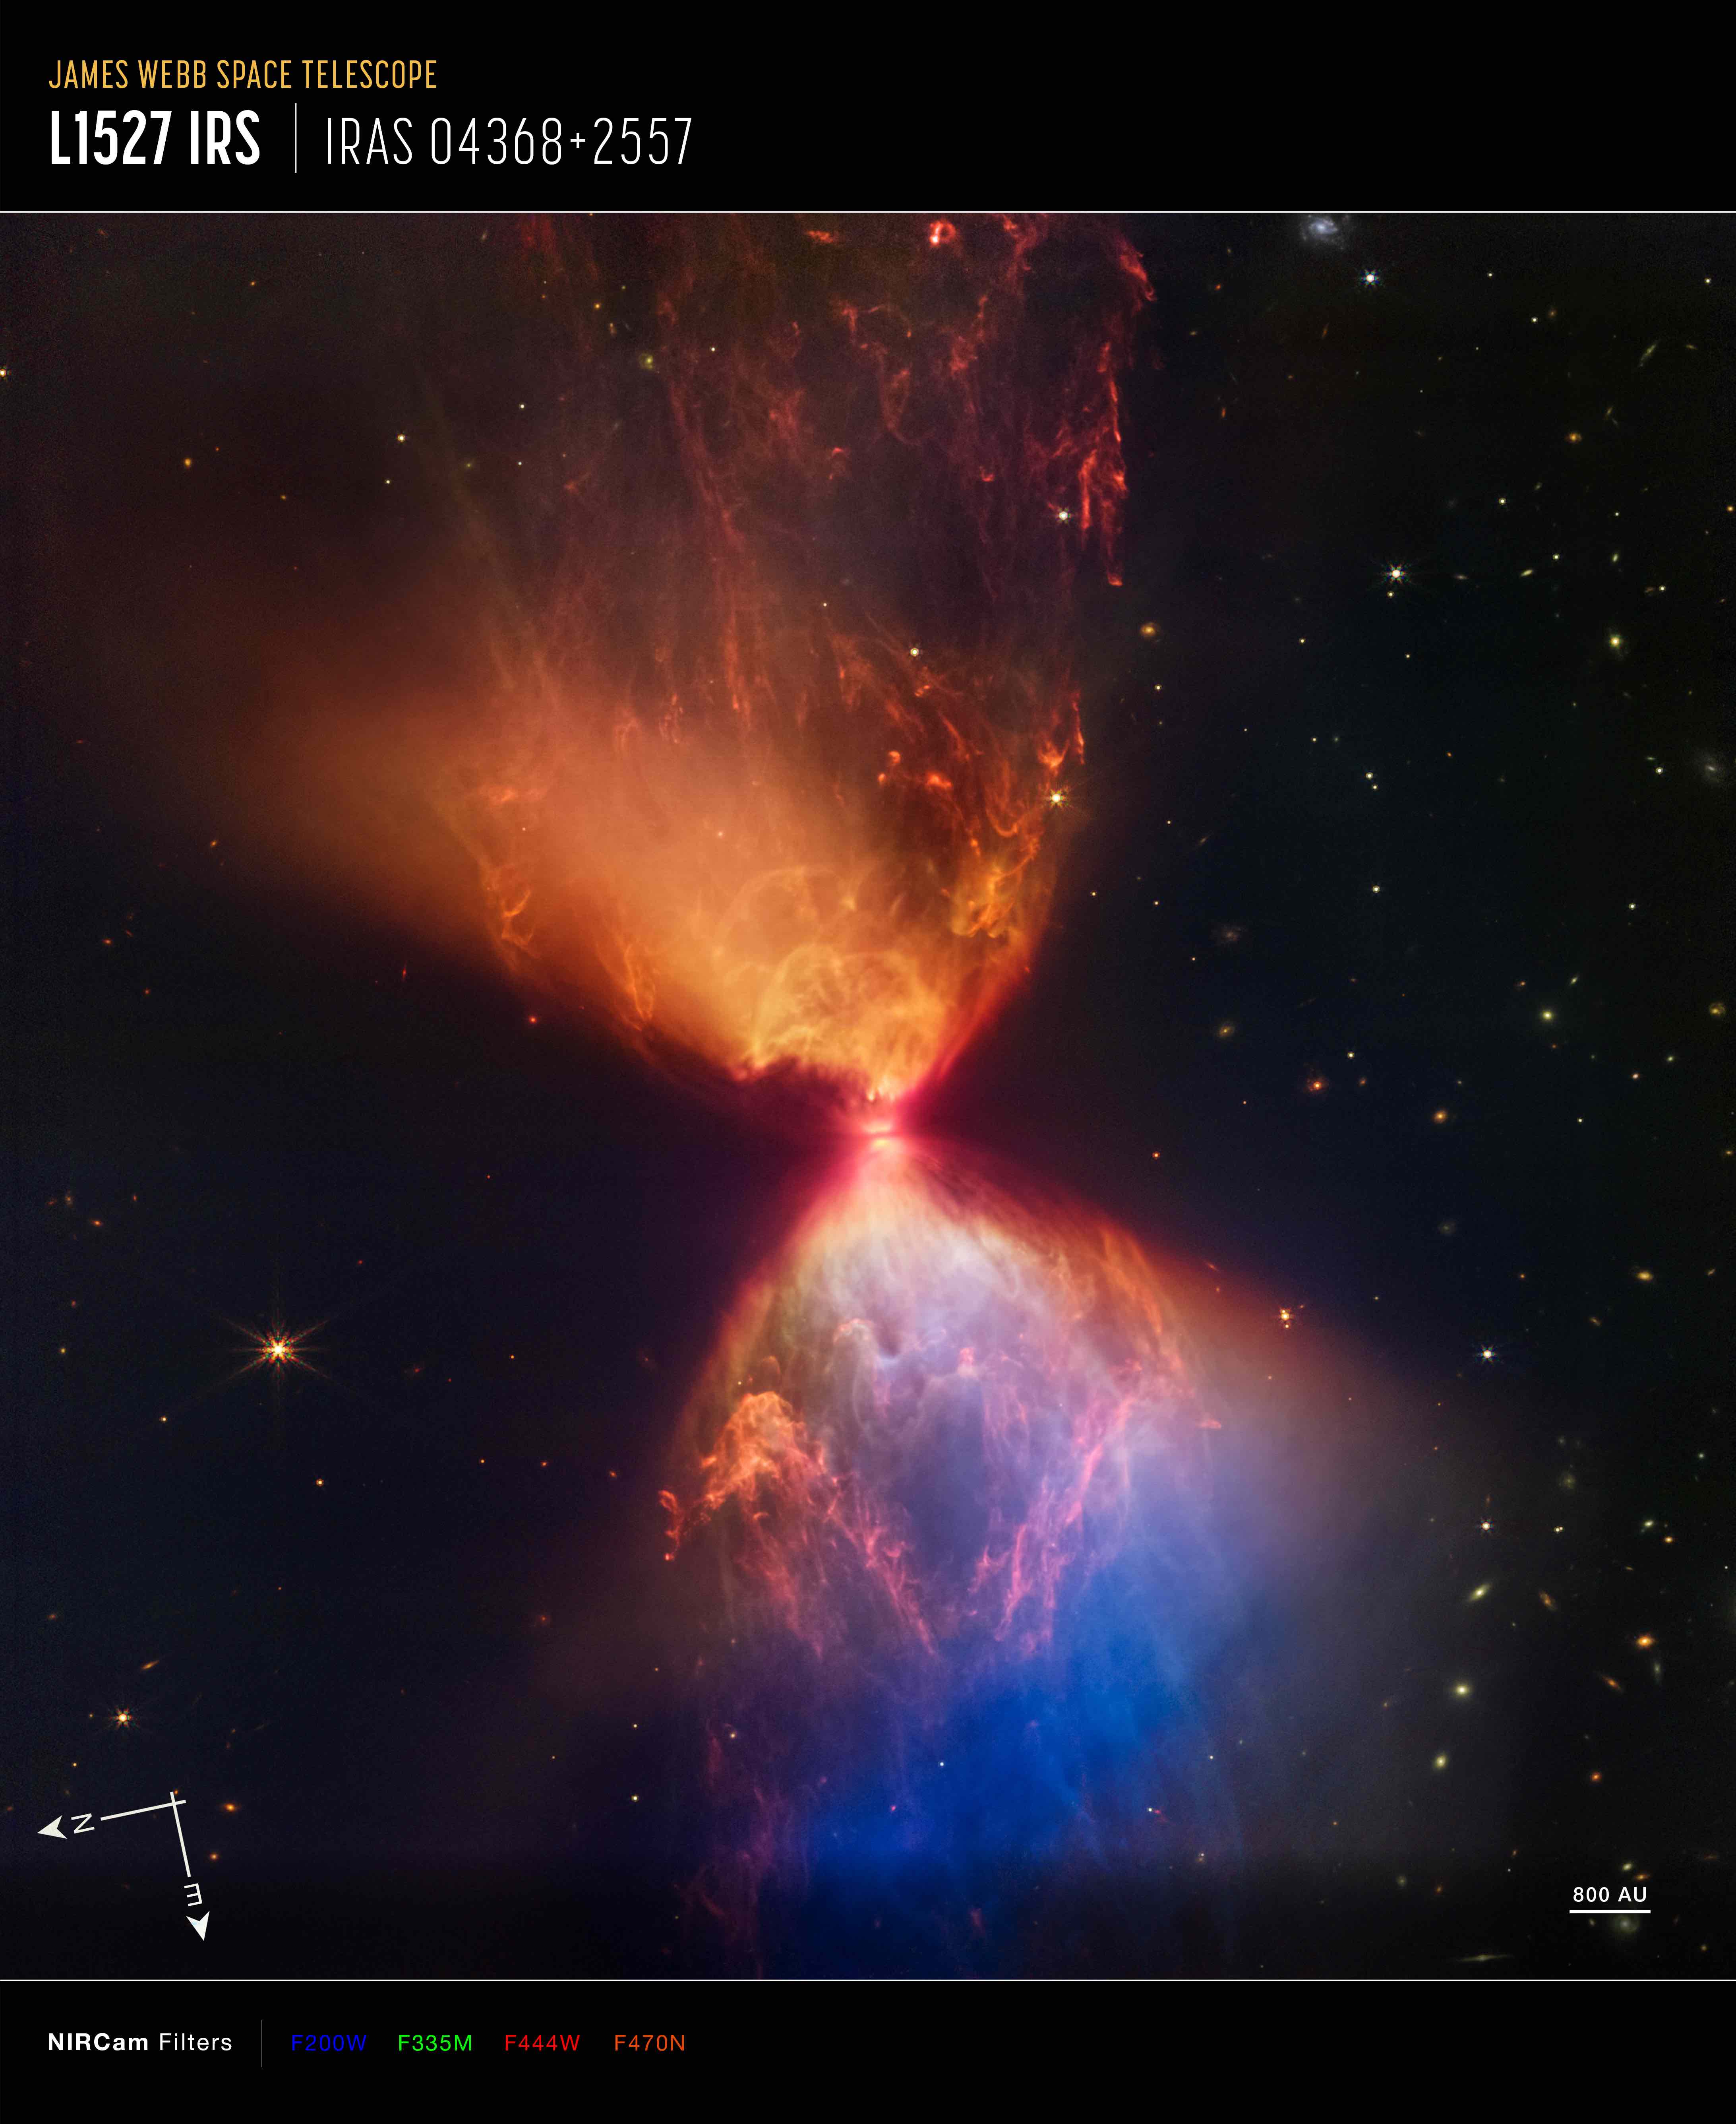
The protostar within the dark cloud L1527, shown in this image from NASA’s James Webb Space Telescope Near-Infrared Camera (NIRCam), is embedded within a cloud of material feeding its growth.
Credit: NASA, ESA, CSA, and STScI. Image processing: J. DePasquale, A. Pagan, and A. Koekemoer (STScI)
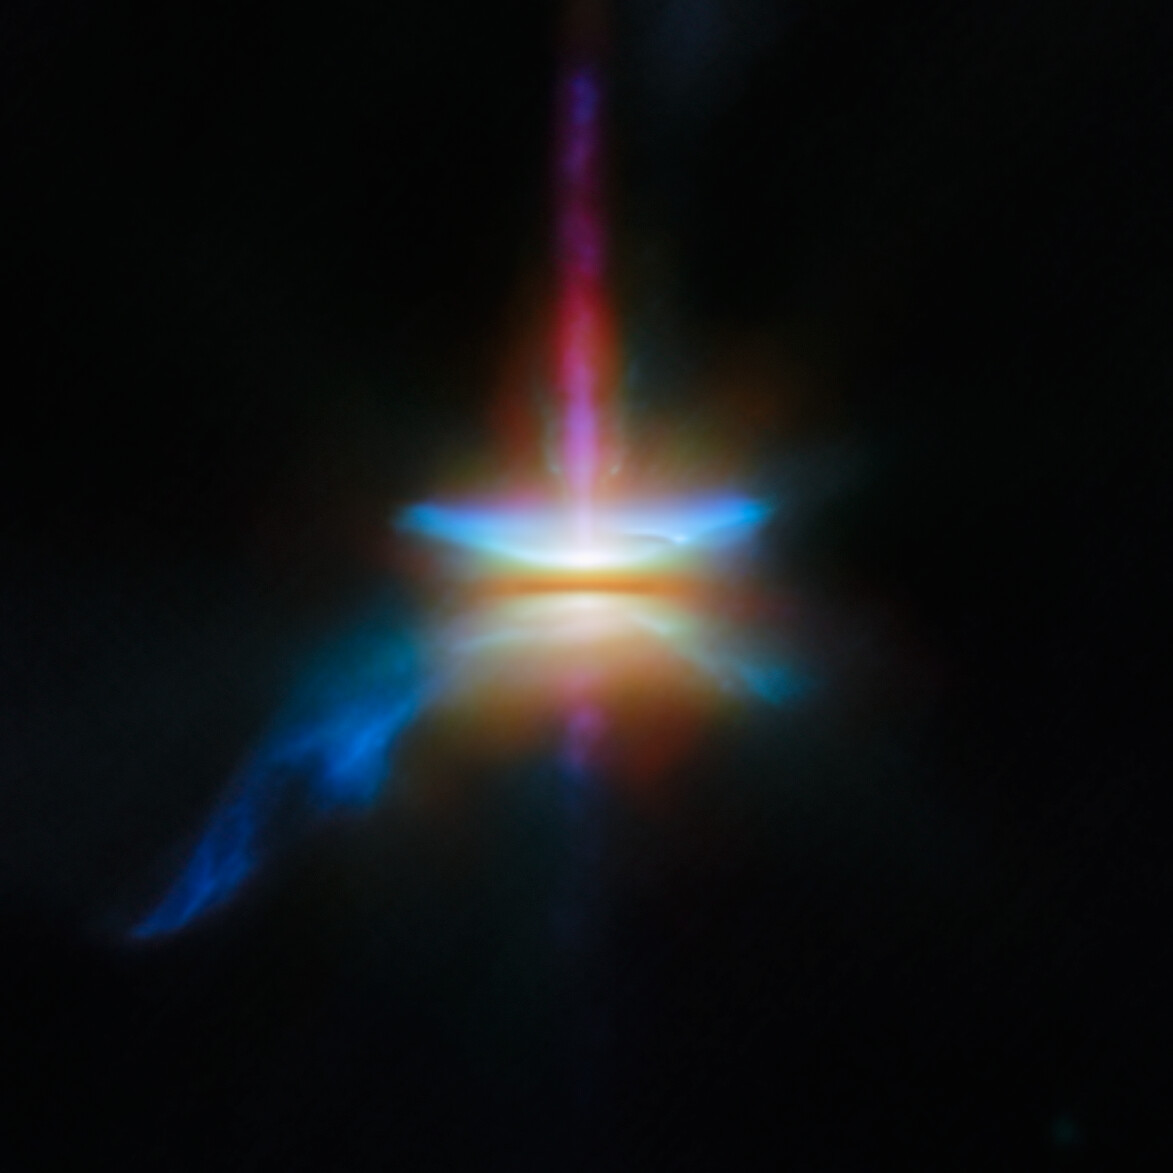
This new NASA/ESA/CSA James Webb Space Telescope Picture of the Month presents HH 30 in unprecedented resolution. This target is an edge-on protoplanetary disc that is surrounded by jets and a disc wind, and is located in the dark cloud LDN 1551 in the Taurus Molecular Cloud.
Credit: ESA/Webb, NASA & CSA, Tazaki et al.
Dissociation and ionization#
As the protostellar core continues to contract the gas behaves like an ideal gas.
However, at \(T\sim2000\) K molecular hydrogen starts to disassociate, and HSE is again lost and dynamical collapse begins again.
Once \(H_{2}\) is fully disassociated into atomic H, HSE is restored.
The final result is ionization of the H and He at \(T\sim10^{4}\) K, the protostar is back in HSE at a much reduced radius.
Pre-main sequence phase#
Eventually, the accretion will slow down and stop the protostar is now a pre-main sequence star.
It’s luminosity is now given by the gravitational contraction and according to the virial theorem follows
At such low temperatures, the opacity of the of pre-MS star is very high throughout, radiative heat transfer is inefficient and the star is fully convective throughout.
Recalling the Hayashi line#
Fully convective stars of a given mass occupy a nearly vertical line in the HR diagram (\(T_{\rm{eff}}\approx\) constant). This is the Hayashi Line/Track.
the region to the right is now as the forbidden region and fully convective stars in HSE cannot ocupy.
to the left, these stars are not fully convective and some regions must be radiative.
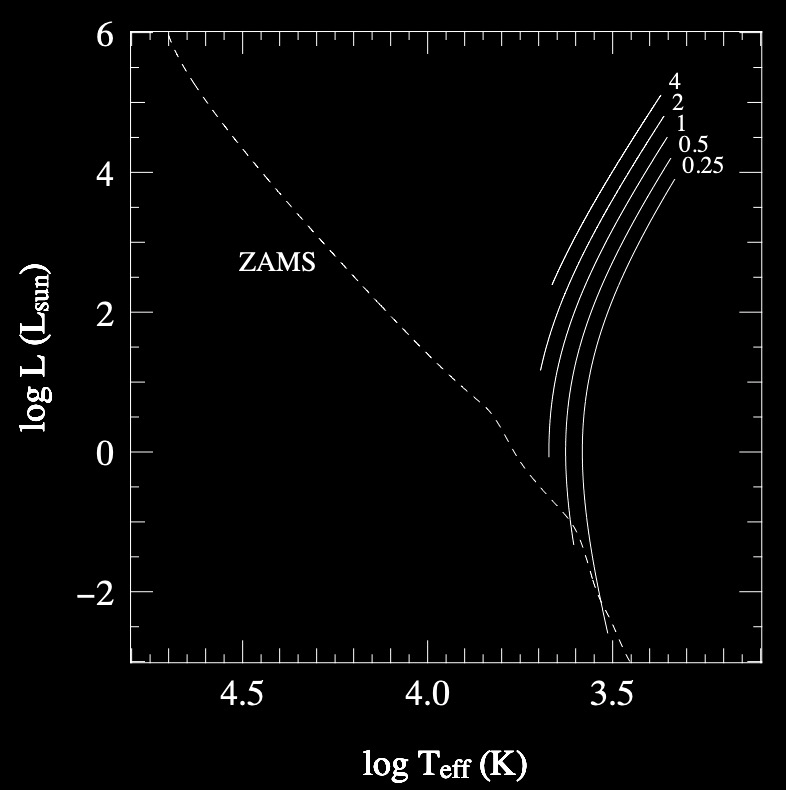
The position of the Hayashi lines in the H-R diagram. Note: The slope is not exactly constant, this is due in part to neglect of ionization zones and superadiabicity regions in the extended outer layers. Credit: Onno Pols.
In-Class Assignment 20#
In-Class Assignment 20 can be found here.