An Overview of Stellar Evolution#
Friday, Jan. 24, 2025
astrophysics of stars and planets - spring 2025 - university of arizona, steward observatory
Today’s Agenda#
Announcements / Recap (2m)
Dicuss Readings/ICA (5m)
Reading Overview/Key Points (15m)
In-Class MESA Assignment (Groups of 2) (20m)
Debrief on ICA (5m)
The Hertzsprung-Russell (HR) Diagram#
Two dimensional diagram used to characterize key observational properties of stars. The Y-axis is a measure of the power output of the star, while the abscissa (X-axis) is used to denote color (or surface temperature) of the star.
It has two main flavors:
Observer’s HR Diagram: Y-axis might express power in terms of magnitudes while the X-axis would be color, the difference in magnitudes between two spectral bands.
Theorist’s HR Diagram: Y-axis is usually express power in terms of luminosity while the X-axis would be effective temperature (\(T_{\rm{eff}}\)).
The relationship between luminosity and effective temperature is given by the following equation:
Definition 16
where \(\sigma\) is the Stefan-Boltzmann’s constant with value of \(5.6705\times10^{-5}\) erg cm\(^{-2}\) K\(^{-4}\) s\(^{-1}\)
Observation 2
In this equation \(R\) is assumed to be the radius at the visible surface of the star (the photosphere) and \(T_{\rm{eff}}\) is the temperature at that surface.
We can similarly create a scaled version of the above equation plugging in \(L_{\odot}\) and \(R_{\odot}\) to find
Definition 17
Example HR diagram from Iben 1991:
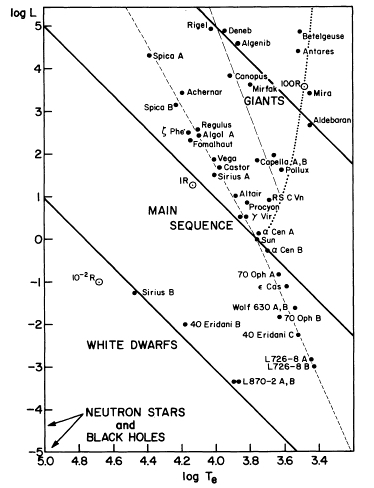
An illustrative Hertzsprung-Russell diagram showing nearby and bright stars as seen from the earth.
Observation 3
Note, the abscissa is backwards! From left to right, we go from hotter to cooler stars.
Pre-Main Sequence Evolution#
The Hayashi track#
Key considerations for protostellar models:
Because of the high total luminosity, the interior of a nonaccreting hydrostatic protostellar model is convective.
For fully convective stars, it is not possible to build a hydrostatic model if the temperature falls below a certain value,thus there is a “forbidden region” in the H-R diagram.
The boundary of this forbidden region is almost vertical for a given mass star, so that as a star contracts it evolves at roughly constant effective temparture.
This forbidden region is known as the Hayashi track.
A protostar leaves the Hayashi track when it either deviates to the Henyey track or nuclear fusion occurs and the star reaches the main sequence. This differences are all reliant of the initial mass of the star.
Example HR diagram from Stahler 1988 showing low mass stellar evolution tracks along the Hayashi and Henyey tracks until reaching the Main Sequence:
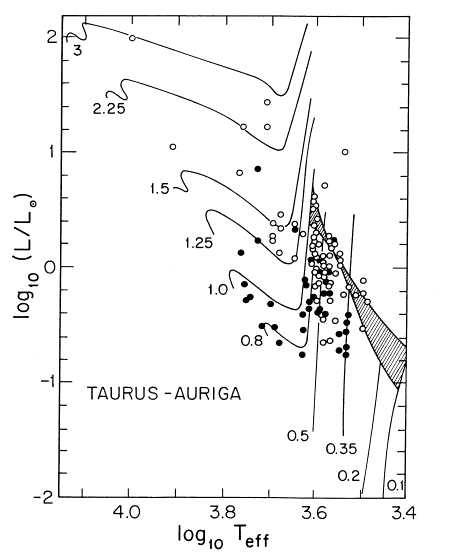
Shown are pre-main sequence evolutionary tracks adopted by Stahler (1988) from various sources. Masses are in solar units. Also shown are the observed locations of a number of T Tauri stars.
T Tauri Stars are those that are still contracting towards the main-sequence.
Single Stars On and Near the Main Sequence#
What’s so main about this sequence?#
Often theorist will say a star has reached the main-sequence if the following is true:
chemically homogeneous with identical or very similar compositions
hydrostatic and thermal balance
energy is derived solely from nuclear burning
We can also define the Zero-Age Main-Sequence (ZAMS) as the time at which the stellar model satisfies these requirements.
Key takeaway: ZAMS solutions for stars with identical mass or composition in stellar modeling are not unique due to many uncertainties from: equations of state, opacities, and nuclear generation rates. We will discuss all of these in more detail in later chapters.
Evolution of Single Stars Off the Main Sequence#
Evolution off of the main sequence will depend on the initial mass. Lets categorize them as follows:
Unevolved Lower ZAMS:#
Using HKT Eq. 1.88 \(t_{\rm{nuc}}\approx 10^{10}\left ( \frac{M}{M_{\odot}} \right )^{-2.5} \geq 17\) Gyr, greater than a Hubble time for stars \(lt\) 0.8\(M_{\odot}\).
Lower:#
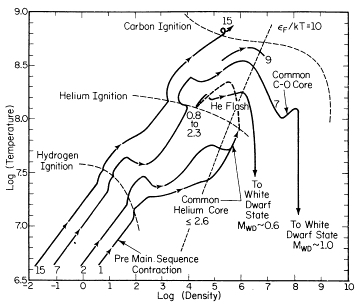
Mass range of \(\approx0.8-1.0M_{\odot}\) to \(\approx2.0-2.3M_{\odot}\) depending on composition. These mass ranges undergo helium ignition in the electron degenerate regime (they are to the right of the \(\epsilon_{\rm{F}}/kT=10\)). Models to the left are non-degenerate and obey ideal gas laws.
Intermediate:#
At mass ranges of about 3\(M_{\odot}\) to about 8-9\(M_{\odot}\) helium ignition occurs in a nondegenerate scenario leading to the build up of a primarily degenerate carbon (\(^{12}\)C) and (\(^{16}\)O) core.
Upper (aka Massive):#
Stars about \(9M_{\odot}\) or greater. The main distinction being from intermediate masses being that a non-degenerate CO core is formed and maintained until C-ignition.
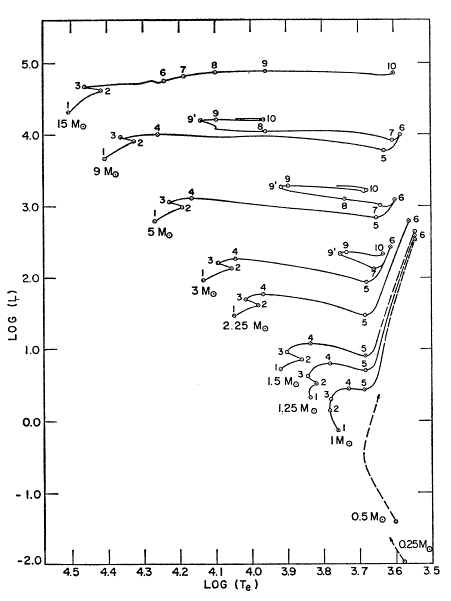
Evolution of stars off of the main sequence for three stellar tracks.
For all the stellar tracks shown below (except the massive star model of 15\(M_{\odot}\)), hydrogen depletion/growth of the helium core is surrounded by an active H-burning shell which provides a power source.
The helium core continues to contract, due to the lack of a burning source.
The contraction and heating of the He-core and the H-shell drives expansion of the stellar envelope. The star becomes evolve towards the red giant branch (3-6).
Where the red giant branch (RGB) is characterized by a continual expansion and reddening of the star to lower effective temperatures.
In-Class Activity#
Head over to ICA3, work with the person next to you.